Table 9.4 shows the results of fitting several models:
general G ![]() E (I); full common-effects G
E (I); full common-effects G ![]() E (II); three common-effects sub-models (III-V); scalar G
E (II); three common-effects sub-models (III-V); scalar G ![]() E (VI); and no G
E (VI); and no G ![]() E interaction (VII). Parameter
estimates subscripted
E interaction (VII). Parameter
estimates subscripted ![]() and
and ![]() refer respectively to single
(unexposed) and married twins. Models including genetic dominance
parameters, rather than common environmental effects, were fitted to
the data. The reader may wish to show that the overall conclusions
concerning G
refer respectively to single
(unexposed) and married twins. Models including genetic dominance
parameters, rather than common environmental effects, were fitted to
the data. The reader may wish to show that the overall conclusions
concerning G ![]() E interaction do not differ if shared
environment parameters are substituted for genetic dominance.
E interaction do not differ if shared
environment parameters are substituted for genetic dominance.
| MODEL | |||||||
| Parameter | I | II | III | IV | V | VI | VII |
| 0.187 | 0.187 | 0.207 | 0.209 | 0.186 | 0.206 | 0.188 | |
| 0.106 | 0.105 | - | - | - | - | - | |
| 0.240 | 0.240 | 0.246 | 0.245 | 0.257 | 0.247 | 0.246 | |
| 0.048 | 0.048 | 0.163 | 0.162 | 0.186 | 0.206 | 0.188 | |
| 0.171 | 0.173 | - | - | - | - | - | |
 |
0.232 | 0.232 | 0.243 | 0.245 | 0.232 | 0.247 | 0.246 |
 |
0.008 | - | - | - | - | - | - |
| - | - | - | - | - | 0.916 | - | |
| 15.44 | 15.48 | 18.88 | 18.91 | 22.32 | 20.08 | 27.19 | |
| 11 | 12 | 14 | 15 | 15 | 15 | 16 | |
| 0.16 | 0.22 | 0.17 | 0.22 | 0.10 | 0.17 | 0.04 | |
| -6.56 | -9.52 | -9.12 | -11.09 | -7.68 | -9.92 | -4.81 | |
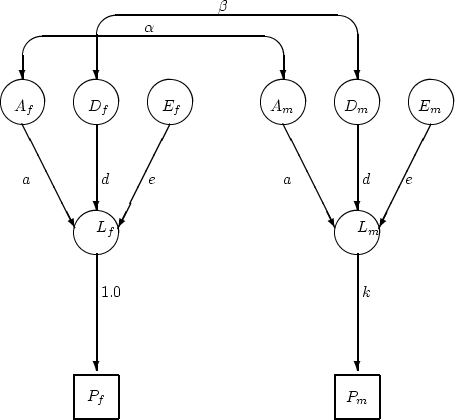
Model I is a general G ![]() E model with
environment-specific additive genetic effects. It provides a
reasonable fit to the data ( = 0.16), with all parameters of
moderate size, except . Under model II, the parameter
is set to zero, and the fit is not significantly worse than
model I (
E model with
environment-specific additive genetic effects. It provides a
reasonable fit to the data ( = 0.16), with all parameters of
moderate size, except . Under model II, the parameter
is set to zero, and the fit is not significantly worse than
model I (![]() = 0.04, = 0.84). Thus, there is no
evidence for environment-specific additive genetic effects. As an
exercise, the reader may verify that the same conclusion can be made
for environment-specific dominant genetic effects.
= 0.04, = 0.84). Thus, there is no
evidence for environment-specific additive genetic effects. As an
exercise, the reader may verify that the same conclusion can be made
for environment-specific dominant genetic effects.
Under model III, we test whether the dominance effects on single and
married individuals are significant. A ![]() difference of 3.40
( = 0.183, 2 df.) between models III and II indicates that they
are not. Consequently, model III, which excludes common dominance
effects while retaining common additive genetic and specific
environmental effects, is favored.
difference of 3.40
( = 0.183, 2 df.) between models III and II indicates that they
are not. Consequently, model III, which excludes common dominance
effects while retaining common additive genetic and specific
environmental effects, is favored.
Models IV - VII are all sub-models of III: the first specifies no
differences in environmental variance components across exposure
groups; the second specifies no differences in genetic variance
components across groups; the third constrains the genetic and
environmental variance components of single twins to be scalar
multiples of those of married twins; and the fourth specifies no
genetic or environmental differences between the groups. When each of
these is compared to model III using a ![]() difference test,
only model VII (specifying complete homogeneity across groups) is
significantly worse than the fuller model (
difference test,
only model VII (specifying complete homogeneity across groups) is
significantly worse than the fuller model (![]() = 8.28, p =
0.004). In order to select the best sub-models from IV, V and VI,
Akaike's Information Criteria were used. These
criteria indicate that model IV -- which allows for group differences
in genetic, but not environmental, effects -- gives the most
parsimonious explanation for the data. Under model IV, the
heritability of depression is 42% for single, and 30% for married
twins. This finding supports our hypothesis that marriage or marriage
type relationships act as a buffer against the expression of inherited
liability to depression.
= 8.28, p =
0.004). In order to select the best sub-models from IV, V and VI,
Akaike's Information Criteria were used. These
criteria indicate that model IV -- which allows for group differences
in genetic, but not environmental, effects -- gives the most
parsimonious explanation for the data. Under model IV, the
heritability of depression is 42% for single, and 30% for married
twins. This finding supports our hypothesis that marriage or marriage
type relationships act as a buffer against the expression of inherited
liability to depression.