


Next: 6 Exercises
Up: 7 Power and Sample
Previous: 4 Power for the
Index
5 Loss of Power with Ordinal Data
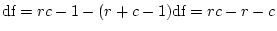
An important factor which affects power but is often overlooked is the
form of measurement used. So far we have considered only continuous,
normally distributed variables, but of course, these are not always
available in the biosocial sciences. An exhaustive treatment of the
power of the ordinal classical twin study is beyond the scope of this
text, but we shall simply illustrate the loss of power incurred when
we use more crude scales of measurement (Neale et al., 1994).
Consider the example above,
but suppose this time that we wish to detect the presence of additive
genetic effects,  , in the data. For the continuous case this is
a trivial modification of the input file to fit a model with just
, in the data. For the continuous case this is
a trivial modification of the input file to fit a model with just  and
and  parameters. The chi-squared from running this program is
 , and following the algebra above (equation 7.1) we
see that we would require
, and following the algebra above (equation 7.1) we
see that we would require
 pairs in total
to be 80% certain of rejecting the hypothesis that additive genes do
not affect variation when in the true world they account for 30%,
with shared environment accounting for a further 20%. Suppose now
that rather than measuring on a continuous scale, we have a
dichotomous scale which bisects the population; for example, an item
on which 50% say `yes' and 50% say no. The data for this case may
be summarized as a contingency table, and we wish to generate tables
that: (i) have a total sample size of 1000; (ii) reflect a correlation
in liability of .5 for MZ and .35 for DZ twins; and (iii) reflect our
threshold value of 0 to give 50% either side of the threshold. Any
routine that will compute the bivariate normal integral for given
thresholds and correlation is suitable to generate the expected
proportions in each cell. In this case we use a short Mx script
(Neale, 1991) to generate the data
for PRELIS. We can use the weight option in
PRELIS to indicate the cell counts for our contingency tables. Thus,
the PRELIS script might be:
pairs in total
to be 80% certain of rejecting the hypothesis that additive genes do
not affect variation when in the true world they account for 30%,
with shared environment accounting for a further 20%. Suppose now
that rather than measuring on a continuous scale, we have a
dichotomous scale which bisects the population; for example, an item
on which 50% say `yes' and 50% say no. The data for this case may
be summarized as a contingency table, and we wish to generate tables
that: (i) have a total sample size of 1000; (ii) reflect a correlation
in liability of .5 for MZ and .35 for DZ twins; and (iii) reflect our
threshold value of 0 to give 50% either side of the threshold. Any
routine that will compute the bivariate normal integral for given
thresholds and correlation is suitable to generate the expected
proportions in each cell. In this case we use a short Mx script
(Neale, 1991) to generate the data
for PRELIS. We can use the weight option in
PRELIS to indicate the cell counts for our contingency tables. Thus,
the PRELIS script might be:
Power calculation MZ twins
DA NI=3 NO=0
LA; SIM1 SIM2 FREQ
RA FI=expectmz.frq
WE FREQ
OR sim1 sim2
OU MA=PM SM=SIMMZ.COV SA=SIMMZ.ASY PA
with the file expectmz.frq looking like this:
0 0 333.333
0 1 166.667
1 0 166.667
1 1 333.333
A similar approach with the DZ correlation and thresholds gives
expected frequencies which can be used to compute the asymptotic
variance of the tetrachoric correlation
for this second group. The simulated DZ frequency data might appear
as
0 0 306.9092
0 1 193.0908
1 0 193.0908
1 1 306.9092
The cells display considerable symmetry -- there are as many
concordant `no' pairs as there are concordant `yes' pairs because the
threshold is at zero. Running PRELIS generates output files, and we
can see immediately that the correlations for MZ and DZ twins remain
the desired .5 and .35 assumed in the population. The next step is to
feed the correlation matrix and the weight matrix (which only contains
one element, the asymptotic variance of the correlation between twins)
into Mx, in place of the covariance matrix that we supplied for
the continuous case. This can be achieved by changing just three
lines in each group of our Mx power script:
#NGroups 2
Data NInput_vars=2 NObservations=1000
PMatrix File=SIMMZ.COV
ACov File=SIMMZ.ASY
with corresponding filenames for the DZ group, of course. When we fit
the model to these summary statistics we observe a much smaller
 than we did for the continuous case; the is only
6.08, which corresponds to a requirement of 2,582 pairs in total for
80% power at the .05 level. That is, we need more than three
times as many pairs to get the same information about a binary item
than we need for a continuous variable. The situation further
deteriorates as we move the threshold to one side of the distribution.
Simulating contingency tables, computing tetrachorics and weight
matrices, and fitting the false model when the threshold is one
standard deviation (SD) to the right (giving 15.9% in one category
and 84.1% in the other), the is a mere 3.29, corresponding a
total sample size of 4,772 total pairs. More extreme thresholds
further reduce power, so that for an item (or a disease) with a 95:5%
split we would require 13,534 total pairs. Only in the largest
studies could such sample sizes be attained, and they are quite
unrealistic for data that could be collected by personal interview or
laboratory measurement. On the positive side, it seems unlikely that
given the advantages of the clinical interview or laboratory setting,
our only measure could be made at the crude `yes or no' binary
response level. If we are able to order our data into more than two
categories, some of the lost power can be regained. Following the
procedure outlined above, and assuming that there are two thresholds,
one at
than we did for the continuous case; the is only
6.08, which corresponds to a requirement of 2,582 pairs in total for
80% power at the .05 level. That is, we need more than three
times as many pairs to get the same information about a binary item
than we need for a continuous variable. The situation further
deteriorates as we move the threshold to one side of the distribution.
Simulating contingency tables, computing tetrachorics and weight
matrices, and fitting the false model when the threshold is one
standard deviation (SD) to the right (giving 15.9% in one category
and 84.1% in the other), the is a mere 3.29, corresponding a
total sample size of 4,772 total pairs. More extreme thresholds
further reduce power, so that for an item (or a disease) with a 95:5%
split we would require 13,534 total pairs. Only in the largest
studies could such sample sizes be attained, and they are quite
unrealistic for data that could be collected by personal interview or
laboratory measurement. On the positive side, it seems unlikely that
given the advantages of the clinical interview or laboratory setting,
our only measure could be made at the crude `yes or no' binary
response level. If we are able to order our data into more than two
categories, some of the lost power can be regained. Following the
procedure outlined above, and assuming that there are two thresholds,
one at 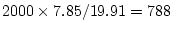 SD and one at
  SD, then the obtained is 8.16,
corresponding to `only' 1,924 pairs for 80% chance of finding
additive variance significant at the .05 level. If one threshold is 0
and the other at 1 SD then the rises slightly to 9.07,
or 1,730 pairs. Further improvement can be made if we increase the
measurements to comprise four categories. For example, with
thresholds at ,
SD, then the obtained is 8.16,
corresponding to `only' 1,924 pairs for 80% chance of finding
additive variance significant at the .05 level. If one threshold is 0
and the other at 1 SD then the rises slightly to 9.07,
or 1,730 pairs. Further improvement can be made if we increase the
measurements to comprise four categories. For example, with
thresholds at ,  , and
, and 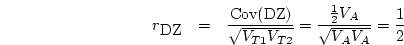 SD the is 12.46,
corresponding to a sample size of 1,240 twin pairs.
While estimating tetrachoric correlations from a random sample of the
population has considerable advantages, it is not always the method of
choice for studies focused on a single outcome, such as schizophrenia.
In cases where the base rates are so low (e.g., 1%) then it becomes
inefficient to sample randomly, and an
ascertainment scheme in which we select cases and
examine their relatives is a practical and powerful alternative, if we
have good information on the base rate in the population studied.
The necessary power calculations can be performed using
the computer packages LISCOMP (Muthén, 1987) or Mx (Neale, 1997).
SD the is 12.46,
corresponding to a sample size of 1,240 twin pairs.
While estimating tetrachoric correlations from a random sample of the
population has considerable advantages, it is not always the method of
choice for studies focused on a single outcome, such as schizophrenia.
In cases where the base rates are so low (e.g., 1%) then it becomes
inefficient to sample randomly, and an
ascertainment scheme in which we select cases and
examine their relatives is a practical and powerful alternative, if we
have good information on the base rate in the population studied.
The necessary power calculations can be performed using
the computer packages LISCOMP (Muthén, 1987) or Mx (Neale, 1997).
Next: 6 Exercises
Up: 7 Power and Sample
Previous: 4 Power for the
Index
Jeff Lessem
2002-03-21