


Next: 2 General Sex-limitation Model
Up: 2 Sex-limitation Models
Previous: 2 Sex-limitation Models
Index
1 General Model for Sex-limitation
The general sex-limitation model allows us to (1) estimate
the magnitude of genetic and environmental effects on male and
female phenotypes and (2) determine whether or not it is the same
set of genes or shared environmental experiences that influence a
trait in males and females. Although the first task may be achieved
with data from like-sex twin pairs only, the second task requires that
we have data from opposite-sex pairs (Eaves
et al., 1978). Thus, the Mx script we describe
will include model specifications for all 5 zygosity groups (MZ-male,
MZ-female, DZ-male, DZ-female, DZ-opposite-sex).
To introduce the general sex-limitation model, we consider a path
diagram for opposite-sex pairs, shown in Figure 9.1. Included
among the ultimate variables in the diagram are female and male
additive genetic ( and
and  ), dominant genetic (
 and
and
 ), and unique environmental (
 and
and  ) effects,
which influence the latent phenotype of the female (
) effects,
which influence the latent phenotype of the female ( ) or male
(
) or male
( ) twin. The additive and dominant genetic effects are
correlated within twin pairs (
) twin. The additive and dominant genetic effects are
correlated within twin pairs ( = 0.50 for additive effects,
and
= 0.50 for additive effects,
and  = 0.25 for dominant effects) as they are for DZ like-sex
pairs in the simple univariate ACE model. This correlational
structure implies that the genetic effects represent common sets
of genes which influence the trait in both males and females; however,
since
= 0.25 for dominant effects) as they are for DZ like-sex
pairs in the simple univariate ACE model. This correlational
structure implies that the genetic effects represent common sets
of genes which influence the trait in both males and females; however,
since  and
and  or
or  and
and  are not constrained
to be equal, the common effects need not have the same magnitude
across the sexes.
are not constrained
to be equal, the common effects need not have the same magnitude
across the sexes.
Figure 9.1:
The general genotype  sex interaction
model for twin data. Path diagram is shown for DZ opposite-sex twin
pairs. = 0.5 and = 0.25.
sex interaction
model for twin data. Path diagram is shown for DZ opposite-sex twin
pairs. = 0.5 and = 0.25.
 |
Figure 9.1 also includes ultimate variables for the male (or female)
member of the opposite-sex twin pair ( and
and  ) which do
not correlate with genetic effects on the female phenotype. For this
reason, we refer to and as sex-specific variables.
Significant estimates of their effects indicate that the set of genes
which influences a trait in males is not identical to that which
influences a trait in females. To determine the extent of male-female
genetic similarity, one can calculate the male-female genetic
correlation (
) which do
not correlate with genetic effects on the female phenotype. For this
reason, we refer to and as sex-specific variables.
Significant estimates of their effects indicate that the set of genes
which influences a trait in males is not identical to that which
influences a trait in females. To determine the extent of male-female
genetic similarity, one can calculate the male-female genetic
correlation ( ). As usual (see Chapter 2) the
correlation is computed as the covariance of the two variables divided
by the product of their respective standard deviations. Thus, for
additive genetic effects we have
). As usual (see Chapter 2) the
correlation is computed as the covariance of the two variables divided
by the product of their respective standard deviations. Thus, for
additive genetic effects we have
Alternatively, a similar estimate may be obtained for dominant
genetic effects. However, the information available from twin pairs
reared together precludes the estimation of both sex-specific
parameters, 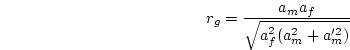 and
and  and, consequently, both additive and
dominance genetic correlations. Instead, models including
or may be fit to the data, and their fits compared
using appropriate goodness-of-fit indices, such as Akaike's
Information Criteria (AIC; Akaike, 1987; see Section
and, consequently, both additive and
dominance genetic correlations. Instead, models including
or may be fit to the data, and their fits compared
using appropriate goodness-of-fit indices, such as Akaike's
Information Criteria (AIC; Akaike, 1987; see Section ![[*]](crossref.png) ).
This
criterion may be used to compare the fit of an
).
This
criterion may be used to compare the fit of an  model to the fit
of an
model to the fit
of an  model. AIC is one
member of a class of indices that reflect both the goodness of fit of
a model and its parsimony, or ability to account for
the observed data with few parameters.
To generalize the model specified in Figure 9.1 to other
zygosity groups, the parameters associated with the female phenotype
are equated to similar effects on the phenotypes of female same-sex MZ
and DZ twin pairs. In the same manner, all parameters associated with
the male phenotype (reflecting effects which are common to both sexes
as well as those specific to males) are equated to effects on both
members of male same-sex MZ and DZ pairs. As a result, the model
predicts that variances will be equal for all female twins, and all
male twins, regardless of zygosity group or twin status (i.e., twin 1
vs. twin 2). The model does not necessarily predict equality of
variances across the sexes.
model. AIC is one
member of a class of indices that reflect both the goodness of fit of
a model and its parsimony, or ability to account for
the observed data with few parameters.
To generalize the model specified in Figure 9.1 to other
zygosity groups, the parameters associated with the female phenotype
are equated to similar effects on the phenotypes of female same-sex MZ
and DZ twin pairs. In the same manner, all parameters associated with
the male phenotype (reflecting effects which are common to both sexes
as well as those specific to males) are equated to effects on both
members of male same-sex MZ and DZ pairs. As a result, the model
predicts that variances will be equal for all female twins, and all
male twins, regardless of zygosity group or twin status (i.e., twin 1
vs. twin 2). The model does not necessarily predict equality of
variances across the sexes.
Next: 2 General Sex-limitation Model
Up: 2 Sex-limitation Models
Previous: 2 Sex-limitation Models
Index
Jeff Lessem
2002-03-21