![[*]](footnote.png) .
Our skinfold assessments include four different
measures which were obtained using standard anthropometric techniques.
The measures were obtained for biceps (BIC), subscapular (SSC), suprailiac
(SUP), and triceps (TRI)skinfolds. The raw data were averaged for the
left and right sides and subjected to a logarithmic transformation prior
to analysis in order to remove the correlation between error variance and
skinfold measure. The
.
Our skinfold assessments include four different
measures which were obtained using standard anthropometric techniques.
The measures were obtained for biceps (BIC), subscapular (SSC), suprailiac
(SUP), and triceps (TRI)skinfolds. The raw data were averaged for the
left and right sides and subjected to a logarithmic transformation prior
to analysis in order to remove the correlation between error variance and
skinfold measure. The 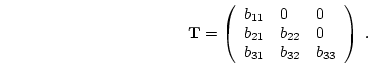 covariance matrices for the male MZ
and DZ twins are given in
Table 10.7.
covariance matrices for the male MZ
and DZ twins are given in
Table 10.7.
| Dizygotic Male Pairs (N=33) | ||||||||
| BIC1 | SSC1 | SUP1 | TRI1 | BIC2 | SSC2 | SUP2 | TRI2 | |
| BIC1 | .1538 | |||||||
| SSC1 | .1999 | .3007 | ||||||
| SUP1 | .2266 | .3298 | .3795 | |||||
| TRI1 | .1285 | .1739 | .2007 | .1271 | ||||
| BIC2 | .0435 | .0336 | .0354 | .0376 | .1782 | |||
| SSC2 | .0646 | .0817 | .0741 | .0543 | .2095 | .3081 | ||
| SUP2 | .0812 | .0901 | .0972 | .0666 | .2334 | .3241 | .3899 | |
| TRI2 | .0431 | .0388 | .0376 | .0373 | .1437 | .1842 | .2108 | .1415 |
| Monozygotic Male Pairs (N=84) | ||||||||
| BIC1 | SSC1 | SUP1 | TRI1 | BIC2 | SSC2 | SUP2 | TRI2 | |
| BIC1 | .1285 | |||||||
| SSC1 | .1270 | .1759 | ||||||
| SUP1 | .1704 | .2156 | .3031 | |||||
| TRI1 | .1035 | .1101 | .1469 | .1041 | ||||
| BIC2 | .0982 | .1069 | .1491 | .0824 | .1233 | |||
| SSC2 | .0999 | .1411 | .1848 | .0880 | .1295 | .1894 | ||
| SUP2 | .1256 | .1654 | .2417 | .1095 | .1616 | .2185 | .2842 | |
| TRI2 | .0836 | .0907 | .1341 | .0836 | .1010 | .1134 | .1436 | .1068 |
| Variable Labels: BIC=Biceps; SSC=Subscapular; SUP=Suprailiac; | ||||||||
| TRI=Triceps. ``1'' and ``2'' refer to measures on first and second twins | ||||||||
![[*]](crossref.png) . The matrices X and
Z are now declared as free lower triangular matrices.
When this program is run with the data from male twins, we obtain a
goodness-of-fit chi-squared of 68.92 for 52 d.f. (
. The matrices X and
Z are now declared as free lower triangular matrices.
When this program is run with the data from male twins, we obtain a
goodness-of-fit chi-squared of 68.92 for 52 d.f. (| Genetic Factor | Environmental Factor | ||||||||
| Variable | 1 | 2 | 3 | 4 | 1 | 2 | 3 | 4 | |
| BIC | 0.340 | 0.000 | 0.000 | 0.000 | 0.170 | 0.000 | 0.000 | 0.000 | |
| SSC | 0.396 | 0.182 | 0.000 | 0.000 | 0.160 | 0.138 | 0.000 | 0.000 | |
| SUP | 0.487 | 0.159 | 0.148 | 0.000 | 0.180 | 0.117 | 0.093 | 0.000 | |
| TRI | 0.288 | 0.016 | 0.036 | 0.110 | 0.117 | 0.039 | -0.004 | 0.085 | |
| Genetic | Environmental | ||||||||
| Variable | BIC | SSC | SUP | TRI | BIC | SSC | SUP | TRI | |
| BIC | 0.116 | 0.135 | 0.166 | 0.098 | 0.029 | 0.027 | 0.030 | 0.020 | |
| SSC | 0.909 | 0.190 | 0.222 | 0.117 | 0.759 | 0.044 | 0.045 | 0.024 | |
| SUP | 0.914 | 0.955 | 0.284 | 0.148 | 0.769 | 0.908 | 0.054 | 0.025 | |
| TRI | 0.927 | 0.863 | 0.894 | 0.097 | 0.778 | 0.757 | 0.716 | 0.023 | |
| Note: The variances are given on the diagonals of the two matrices | |||||||||