


Next: 9 Sex-limitation and G
Up: 4 Consequences for Variation
Previous: 1 Derivation of Expected
Index
2 Numerical Illustration
To illustrate
these effects numerically, let us consider a simplified situation in
which
 in the absence of social
interaction (i.e.,
in the absence of social
interaction (i.e., 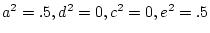 ); in the presence of strong cooperation,
 ; and in the presence of strong competition,
  .
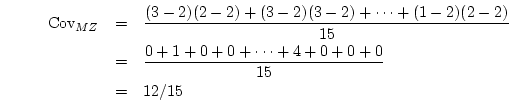
Table 8.4 gives the numerical values for MZ and DZ twins
and unrelated pairs of individuals reared together (e.g., adoptive
siblings).
.
Table 8.4 gives the numerical values for MZ and DZ twins
and unrelated pairs of individuals reared together (e.g., adoptive
siblings).
Table 8.4:
Effects of strong sibling interaction on the variance and
covariance between MZ, DZ, and unrelated individuals reared
together. The interaction parameter  takes the values
  ,
,  ,
and
,
and  for no sibling interaction, cooperation, and competition,
respectively.
for no sibling interaction, cooperation, and competition,
respectively.
| |
MZ twins |
DZ twins |
Unrelated |
| Interaction |
Var |
Cov |
 |
Var |
Cov |
|
Var |
Cov |
|
| None |
1.00 |
.50 |
.50 |
1.00 |
.25 |
.25 |
1.00 |
.00 |
.00 |
| Cooperation |
3.11 |
2.89 |
.93 |
2.67 |
2.33 |
.88 |
2.22 |
1.78 |
.80 |
| Competition |
1.33 |
.44 |
.33 |
1.78 |
-.67 |
-.38 |
2.22 |
-1.78 |
-.80 |
In terms of correlations, phenotypic cooperation mimics the effects
of shared environment while phenotypic competition may mimic the
effects of non-additive genetic variance. However, the effects can be
distinguished because social interactions result in different total
phenotypic variances for differently related pairs of individuals.
All of the other kinds of models we have considered predict that the
population variance of individuals is not affected by the presence or
absence of relatives. However, cooperative interactions increase the
variance of more closely related individuals the most, while
competitive interactions increase them the least and under some
circumstances may decrease them. Thus, in twin data, cooperation is
distinguished from shared environmental effects because cooperation
results in greater total phenotypic variance in MZ than in DZ twins.
Competition is distinguished from non-additive genetic effects because
it results in lower total phenotypic variance in MZ than in DZ twins.
This is the bottom line: social interactions cause the variance of a
phenotype to depend on the degree of relationship of the social
actors.
There are three observations we should make about this result. First,
a test of the contrary assumption, i.e., that the total observed
variance is independent of zygosity in twins, was set out by Jinks and
Fulker (1970) as a preliminary
requirement of their analyses and, as has been noted, is implicitly
provided whenever we fit models without social interactions to
covariance matrices. For I.Q., educational attainment, psychometric
assessments of personality, social attitudes, body mass index, heart
rate reactivity, and so on, the behavior genetic literature is replete
with evidence for the absence of the effects of social
interaction. Second, analyses of family correlations (rather than
variances and covariances) effectively standardize the variances of
different groups of individuals and throw away the very information we
need to distinguish social interactions from other influences. Third,
if we are working with categorical data and adopting a threshold model
(see Chapter 2), we can make predictions about the
standardized thresholds in different groups. Higher quantitative
variances lead to smaller (i.e., less deviant) thresholds and
therefore higher prevalence for the extreme categories. Thus, for
example, if abstinence vs. drinking status is influenced by sibling
cooperation on a latent underlying phenotype, and abstinence has a
frequency of 10% in DZ twins, we should expect a higher frequency of
abstinence in MZ twins. These models are relatively simple to
implement in Mx (Neale, 1997).
Next: 9 Sex-limitation and G
Up: 4 Consequences for Variation
Previous: 1 Derivation of Expected
Index
Jeff Lessem
2002-03-21